Research Article
Another Approach, and Analysis, to Evaluate the Risk of Malaria Transmission in Angola According to Vector Control Method and Duration of Stage: The Birley's Formula 
2 Vector Control in Emergency Situation, Jalan Raya Sakah 22xx, Batuan, Sukawati, Gianyar, Bali, Indonesia-80582
3 Teacher in Risks Protection, 19 Reclus Street, 64300, Orthez, France
4 Director of Research ELII, A. Sakharov Street, Georges Residency, Buiding A, Castelnau-le-Lez, 34170; France
 Author
  Correspondence author
Journal of Mosquito Research, 2026, Vol. 16, No. 1 doi: 10.5376/jmr.2026.16.0001
Received: 27 Jan., 2026 Accepted: 26 Feb., 2026 Published: 05 Mar., 2026
Carnevale N., Carnevale G., Monbeig B., and Carnevale P., 2026, Another approach, and analysis, to evaluate the risk of malaria transmission in angola according to vector control method and duration of stage: the Birley’s Formula, Journal of Mosquito Research, 16(1): 1-20 (doi: 10.5376/jmr.2026.16.0001)
Background:
Three indicators are used to evaluate the entomological intensity of malaria transmission: the “entomological inoculation rate” of Ross; the “reproduction rate” of Macdonald and the “vectorial capacity” of Garrett-Jones. They were successfully used to evaluate the impact of vector control. But they do not consider the duration of stay in malarious area. Therefore, Birley introduced the parameter “t” (in days) in the new formula of the inoculation rate which became h= 1-(1-s)ma.t, where ma= biting rate; s= infectivity and t the time of exposure.
Objective:
We used the Birley’s formula in the framework of the long-term malaria vector control program implemented in eight villages around Balombo (Angola) to compare the efficacy of four methods.
Method:
The method of vector control were: the long-lasting insecticide (deltamethrin) treated nets (“LINs”) PermaNet® 2.0 (P2.0) alone, in two villages; LLINs P2.0 in combination with insecticide (deltamethrin) treated plastic sheeting (“ITPS”) model ZeroFly®, in two villages; ITPS model ZeroVector® (deltamethrin treated) alone, in two villages; and two rounds of lambdacyhalothrin inside residual spraying (“IRS”) followed by installation of ITPS, in two villages. In the first five years both entomological and parasitological field surveys were done every two months, two years before vector control and three years after. Entomological evaluation was based CDC Light Trap inside houses; the “density per trap” was used as a proxy of the “biting rate” inside the house to get the “risks in the house” before and after vector control. Mosquito were identified and analyzed to get species identification and infectivity.
Results:
Main vectors (MV) were Anopheles funestus and An. gambiae which were gathered and used as “ma”, in the Birley’ formula. The risks of being inoculated increased sharply as a logarithmic function of the length of exposure. Without vector control, with an average density of 0.6 “main vectors per trap”, and an infectivity of 4.53% the risks of infections were 2.7% in one day; 17.2% in one week; 55.5% in one week and 99.5% in one year. After vector control, with a density becoming 0.17 main vectors per trap, and an infectivity of 2.59%, the risks were 0.15% in one day; 3.1% in one week; 12.7% in one month and 80.5% in one year; meaning a protection of 94.4% in one day; 82% in one week; 77% in one month and 19% for one year. The trends in the reduction of risks were similar with the four methods of vector control but the level of reduction was different with methods. In the condition of the trial, the best method, in term of efficacy, and long-lasting effect, was the ITPS ZeroVector® alone.
1 Introduction
A WHO Report of Malaria in the World indicated that “an estimated 2.2 billion cases of malaria and 12.7 million deaths have been averted since 2000, but the disease remains a serious global health threat, particularly in the WHO African Region. According to this report, there were an estimated 263 million cases and 597,000 malaria deaths worldwide in 2023. This represents about 11 million more cases in 2023 compared to 2022, and nearly the same number of deaths. Approximately 95% of the deaths occurred in the WHO African Region, where many at risk still lack access to the services they need to prevent, detect and treat the disease” (World Health Organization, 2024).
On the other hand, it was reported “that Plasmodium falciparum infection prevalence in endemic Africa halved and the incidence of clinical disease fell by 40% between 2000 and 2015. We estimate that interventions have averted 663 (542-753 credible interval) million clinical cases since 2000. Insecticide-treated nets, the most widespread intervention, were by far the largest contributor (68% of cases averted)” (Bhatt et al., 2015). Combining the data of WHO on malaria morbidity and estimation of Bhatt et al. (loc.cit.), it could be assumed that some 1,36 billion of clinical cases were averted thanks to large scale distribution of insecticide treated mosquito nets “ITNs have had by far the largest effect, but have also been generally present for longer and at higher levels of coverage. IRS and ACTs have both made important contributions to reducing prevalence and incidence where they have been implemented at scale (although it is important to note that the primary role of ACTs is in averting severe disease and death rather than reducing transmission and uncomplicated cases” (Bhatt et al., loc.cit.).
Reducing transmission is the role of vector control which requires a sound entomological knowledge for its evaluation. The entomological malaria parasite transmission could be described by two factors: rhythm (permanent, seasonal regular long, regular seasonal short, episodic (Boyd, 1949) and intensity. Three main formulae were developed to estimate the amount of entomological transmission in an area or period (dry-rainy season), and its evolution with implementation of vector control. The first notion of «risk with days» seems to be found in the book “Essential Malariology” chapter “Quantitative Epidemiology of Malaria”: many aspects of malaria now require some quantitative data, the collection and interpretation of which depends on the elementary mathematical principles. In answering the usual epidemiological question “Who? When? Why?” some degree of precision is needed. There is no tropical communicable disease in which mathematical approach has been applied more widely and thoroughly more than malaria.” (Bruce-Chwatt, 1985).
The first formulating the quantitative laws of epidemiology of malaria, and its transmission and control, was made by Ronald Ross at the beginning of the XXth century (Ross, 1911). In his book “Theory of Happening” (word from which is issue the famous “h” parameter) Ross developed the concept of Entomological Inoculation Rate (“EIR”) defined as the relative proportion of the human population receiving an infective bite in unit of time, from the average number of Anopheles found in a room or in a hut. It can be estimated by multiplying the anopheles’ density per person per day, by the sporozoite rate. It combined the density of bite received in one night (“ma” for “man-biting rate”) and the infectivity (“s” for “sporozoite index”) of the vector to present the now, famous, and largely used first formula: h=ma. s which represents the number of infective bites of Anopheles vector received in one night (unity of time) by one human being. Thus, “if an average of six Anopheles were found every day in a room where three persons slept and where the sporozoite rate was 5%, then the supposed daily inoculation rate would be (6/3) x 0.050= 0.1 infective bite per human being per night.
However, not all anopheles found in the room would have fed on that night. Assuming a gonotrophic cycle of two days, only half of anopheles would be involved. In view of this, the previous figure of 0.1 must be halved and the postulated figure would be 0.05. Thus, every person in this room would receive an infective bite every 20 days” (Bruce-Chwatt, 1985). It seems that this is the first time that duration of stay in risky area was taken into consideration.
Then, was developed the concept of reproduction rate “z” (Macdonald, 1957). In the course of its time of infectivity (1/r) a case will be bitten each day by ma mosquitoes of which “b” is the proportion having sporozoites in their salivary glands which are actually infective. The probability of a mosquito surviving one day is called “p”. The proportion of mosquitoes surviving for “n” days is pn and their subsequent expectation of life is 1/-loge p. The expectation of life after surviving through n days is pn/-logep. During this time, they will bite “a” time each day (with “a” is defined as “the average number of men bitten by one mosquito in one day”), and b the proportion of these bites will be infective (meaning potentially inducing malaria infection, i.e. without considering human immunity). Thus, the reproduction rate of the parasite by anopheles’ vectors is estimated by the famous formula:
z= ma2bpn/r(-logep)
The reproduction rate corresponds to the total number of new (“secondary”) infections which could be distributed by anopheline population from a single human “primary” infection, in the absence of immunity. The aims of reducing transmission are to decrease this “z” below 1, with entomological action against density of bite (ma), longevity (p), anthropophily (a).
But, considering the issue of evaluation of parameters “r” (called “recovery rate”) and “b” (for actual infectivity of sporozoites) it was developed the concept of vectorial capacity (Garrett-Jones, 1964a) with the simplified formula: CV= ma2pn/-logep
The vectorial capacity is defined as “the average number of inoculations with a specified parasite, originating from one case of malaria in unit time, that a vector population would distribute to man if all the vector females biting the case became infected” (Garrett-Jones and Grab, 1964). The vectorial capacity is thus a density-and longevity dependent attribute of the mosquito and was used for “The Assessment of Insecticidal Impact on the Malaria Mosquito's Vectorial Capacity, from Data on the Proportion of Parous Females” (Garrett-Jones and Grab, loc.cit.). Vectorial capacity is an interesting indicator in epidemiological entomology, for example as “prognosis for interruption of malaria parasite transmission (Garrett-Jones, 1964b) or to evaluate the house spraying with DDT (Garrett-Jones and Shidrawi, 1969) where it was compared to reproduction rate.
Reproduction rate is the total new infections which could occurred from one human infection (with infective gametocytes) while the vectorial capacity is new infections in a unit of time (Smith et al., 2007).
The vectorial capacity is easy to evaluate with the biting rate (ma) and the parous rate (Detinova, 1962) which allows an estimation of the longevity of vectors and the “assessment of insecticidal impact” (Molineaux et al., 1979).
The main parameters used in entomological evaluation of malaria parasite transmission are the inoculation rate and the vectorial capacity.
But, in both formulae, one parameter is not taken into consideration; “t” (in days) of length of stay in malarious area, to evaluate the evolution of the risk of being bitten by infective vector according to the times spent on this place. Dealing with this issue Martin Birley developed a new formula of the risk “hr” of receiving an infective bite according to the density of bite (ma), infectivity of vector (s) and the time, duration of exposure, “t”: and the formula is now hr= 1-(1-s) ma.t
The formula was already used to describe other entomological situation (Gazin et al., 1985) and it is used in Angola to evaluate, and compare, four methods of vector control implemented in Balombo program considering the length of stay of human being in house before, and after, implementation of vector control.
2 Materials and Method
In 2007 a long-term (11 years) comprehensive malaria vector control program was implemented in eight villages around the town of Balombo, (Benguela Province, Angola). The goal was to compare, in natural situation, the efficacy of four methods of vector control: classical long-lasting deltamethrin insecticide treated nets (“LLINs”) PermaNet 2.0®, installed in two villages; LLINs in combination with insecticide (deltamethrin) treated plastic sheeting (“ITPS”) model ZeroFly® in two villages; deltamethrin treated ITPS model ZeroVector® in two villages, and inside residual spraying (“IRS”) in two villages: two rounds house sprays with lambdacyhalothrin followed by installation of ITPS. The first five years evaluation involved entomology, parasitology and immunology. The entomological evaluation included two steps: two years before vector control implementation and three years after. Entomological evaluation was based upon regular use, every two months, of classical CDC Light Trap (“CDC LT”) in ten inhabited houses (one trap per house, always the same). CDC LT were recently used to estimation of entomological inoculation rate in Tanzania (Mboera, 2005) and elsewhere (Service, 1970; Service, 1977).
Anopheles were isolated from the samples of the CDC LT; determined at species level in situ then further biological analysis were performed in OCEAC Organization (Yaoundé, Cameroon) to precise species of the Anopheles gambiae complex and Elisa tests were performed to precise the infectivity of species caught (Beier et al., 1987; Wirtz et al., 1987). The biotope, methods, first entomological parasitological results were already published (Carnevale et al., 2024), and first immunological data were already published (Brosseau et al., 2012). Bruce-Chwatt (1985), considered that sampling inside house will give information of the entomological inoculation rate “at house level”. Thus, was decided to use the Birley’s formula h= 1-(1-s)ma.t to estimate the evolution of risks in houses of the villages according to the duration of stay (in days) and each of the four method of vector control.
3 Results
A total of 202 catching sessions with CDC Light Traps were conducted in the eight villages, representing 1,880 trap-nights, which caught 1,153 Anopheles specimens, belonging to 11 taxa including nine species and one species complex, Gambiae. An. gambiae and An. funestus only were considered as the main vectors (“MV”) for further analysis.
3.1 Evolution of risks before, and after, LLINs full coverage
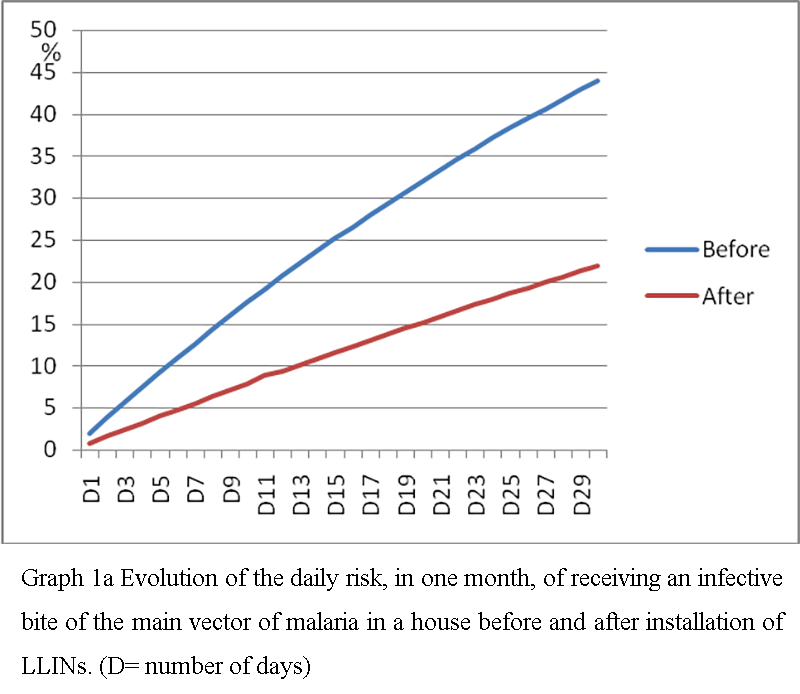
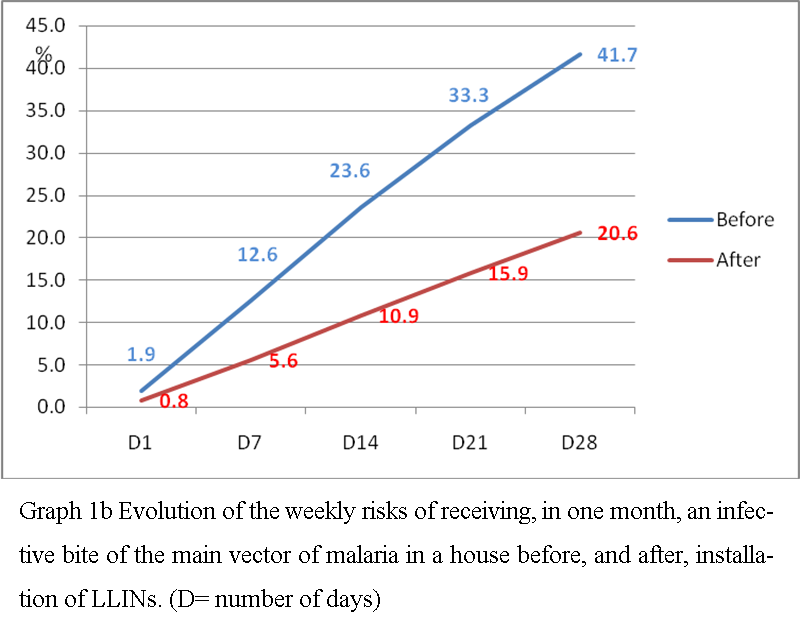
With full coverage in LLINs the number of main vectors per trap decreased from 0.67 to 0.26 and the sporozoite index slightly changed from 2.83% to 3.08%. With these data in the Birley’s formula it is possible to calculate the risk of receiving an infective bite in sleeping one day, one week, one month (Graph 1a, Graph 1b), one year (Graph 1c) in a house without, then with LLINs.
|
Graph 1a Evolution of the daily risk, in one month, of receiving an infective bite of the main vector of malaria in a house before and after installation of LLINs. (D= number of days) |
|
Graph 1b Evolution of the weekly risks of receiving, in one month, an infective bite of the main vector of malaria in a house before, and after, installation of LLINs. (D= number of days) |
|
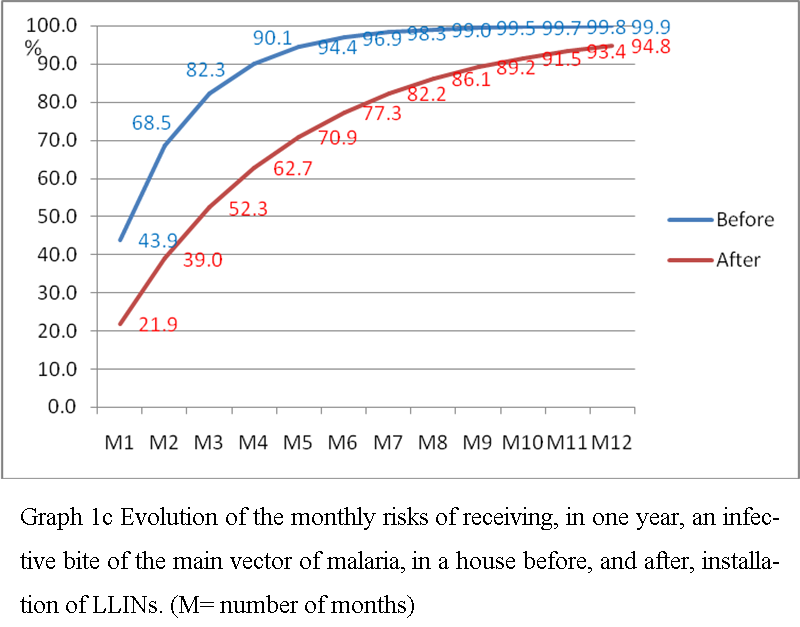
Graph 1c Evolution of the monthly risks of receiving, in one year, an infective bite of the main vector of malaria, in a house before, and after, installation of LLINs. (M= number of months) |
3.1.1 Evolution of the weekly risk in one month
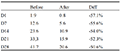
In a house without LLIN the weekly risk sharply increased, 2% in one day; 13% in one week; 24% in two weeks; 33% in three weeks and 42% in four weeks. With installation of LLINs they were respectively reduced at < 1%; 6%; 11%; 16% and 21% meaning that LLIN conferred always a >50% reduction of risks during the month (Table 1a).
|
Table 1a Evolution of the weekly risks, in one month, of getting an infective bite before, and after, full coverage in LLINs; with the difference of risks induced |
3.1.2 Evolution of the monthly risks in one year
Before LLINs installation the risk of being infected was 44% in one month; reached 90% in four months; 97% in six months and 99% in eight months; being #100% in one year. After LLINs installation these risks were respectively 22%; 63%; 77%; 86% and 95% (Table 1b). The reduction of risks with vector control based on LLINs sharply decreased with time; from 50% in one month to 5% in one year. It is of great concern that, even with full coverage in LLINs, the risk of receiving one infective bite in one year could > 90%.
|
Table 1b Evolution of the monthly risks of receiving, in one year an infective bite of the main vectors of malaria, in a house before, and after, installation of LLINs, with the difference of risks |
3.2 Evolution of risks before and after LLINs + ITPS Model ZeroFly®
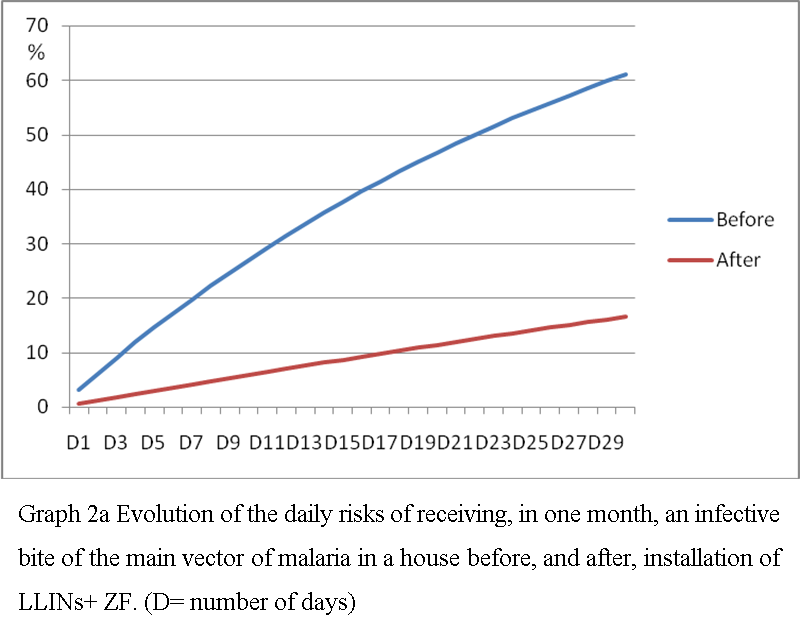
With full coverage in LLINs, in combination of ZF the number of main vectors per trap decreased from 0.73 to 0.23 and the sporozoite index decreased from 4.20% to 2.59%. With these data in the Birley’s formula it is possible to calculate the risk of receiving an infective bite in sleeping one day, one week, one month (Graph 2a, Graph 2b), one year (Graph 2c) in a house without, then with LLINs + ZF.
|
Graph 2a Evolution of the daily risks of receiving, in one month, an infective bite of the main vector of malaria in a house before, and after, installation of LLINs+ ZF. (D= number of days) |
|
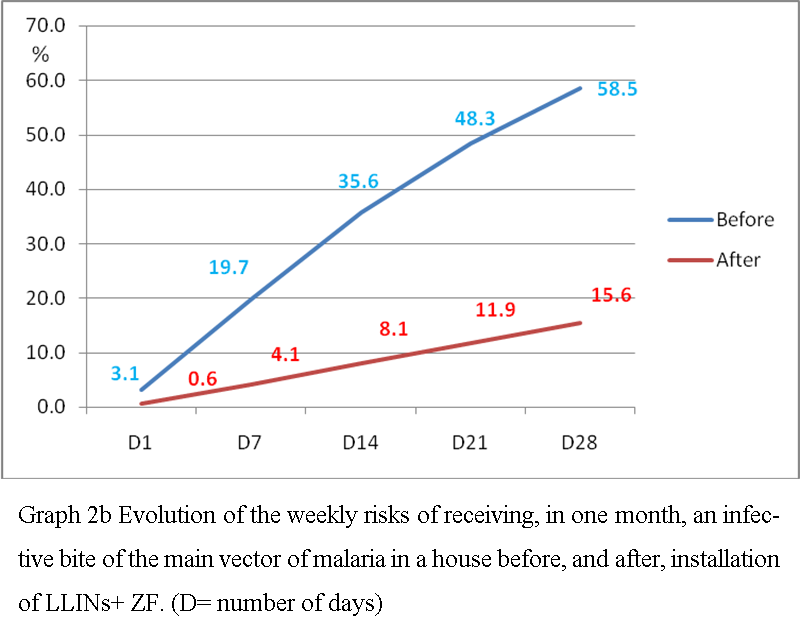
Graph 2b Evolution of the weekly risks of receiving, in one month, an infective bite of the main vector of malaria in a house before, and after, installation of LLINs+ ZF. (D= number of days) |
|
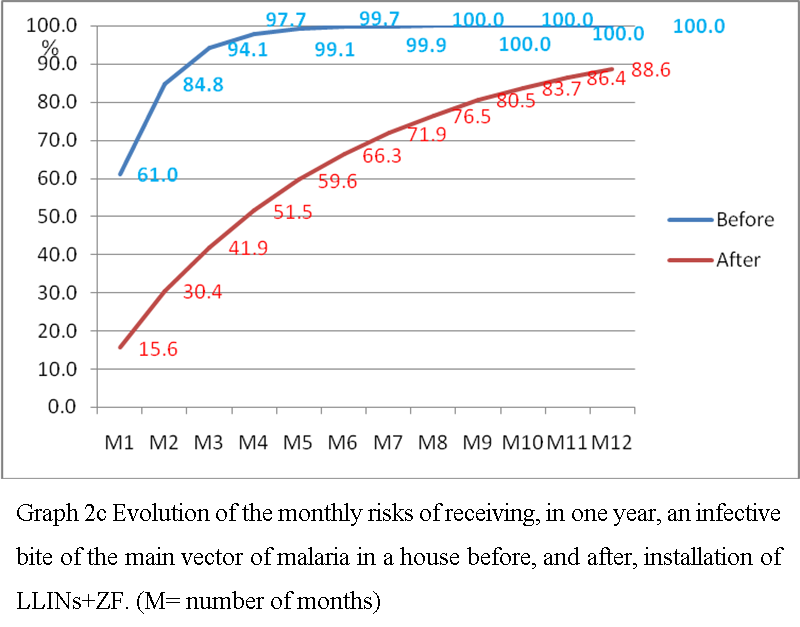
Graph 2c Evolution of the monthly risks of receiving, in one year, an infective bite of the main vector of malaria in a house before, and after, installation of LLINs+ZF. (M= number of months) |
3.2.1 Evolution of the weekly risk in one month
In a house without vector control the weekly risk sharply increased, 3% in one day; 20% in one week; 36% in two weeks; 48% in three weeks and >58% in four weeks. With installation of LLINs + ZF they were respectively reduced at < 1%; 4%; 8%; 12% and 16% meaning that LLIN+ZF conferred a >70% reduction of risks during one month (Table 2a).
|
Table 2a Evolution of the weekly risks, in one month, of getting an infective bite before, and after, full coverage in LLINs+ ZF, with the difference of risks induced |
3.2.2 Evolution of the monthly risks in one year
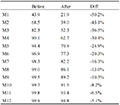
Before LLINs+ ZF installation the risk of being infected reached 61% in one month; 85% in two months; > 90% in three months and > 99% in six months; being #100% in one year. After LLINs + ZF installation these risks were respectively 16%; 30%; 55%, 66% and 89% (Table 2b) meaning a worthy reduction of risks. This reduction of risks: was higher with the combination LLIN+ZF than LLIN alone; decreased with time (Graph 2c); from 75% in one month to 11% in one year.
|
Table 2b Evolution of the monthly risks of receiving an infective bite of the main vector of malaria in a house before, and after, installation of LLINs + ZF; with the difference of risks |
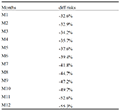
Comparing the reduction of monthly risks conferred by the combination LLN + ZF (Table 2b; column 4) and of LLINs alone (Table 1b; column 4) it appeared that adding ITPS on the wall to nets on sleeping units (Table 2c) exponentially increased the reduction of risks (Table 2c) by some 40% in six months and even >50% in one year (Graph 2d).
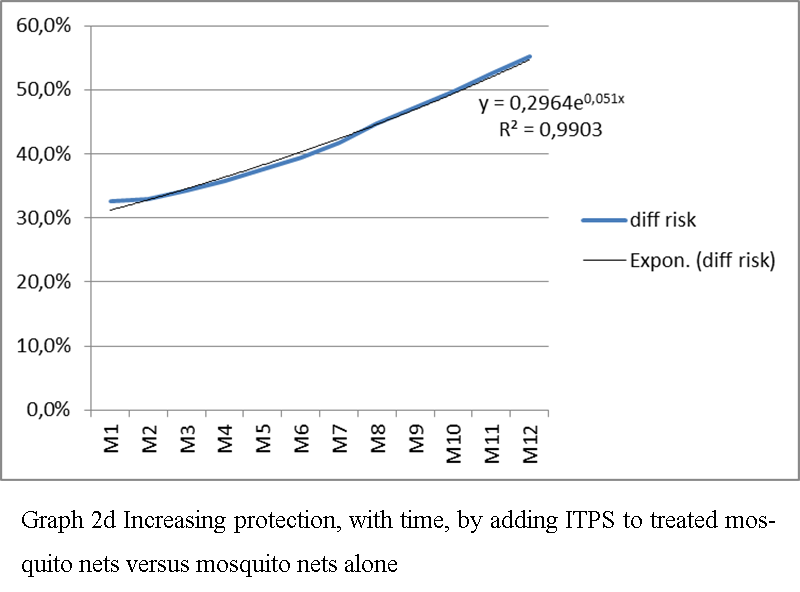 Graph 2d Increasing protection, with time, by adding ITPS to treated mosquito nets versus mosquito nets alone |
|
Table 2c Difference of risks in house with LLINs in combination of ITPS versus houses with LLIN alone |
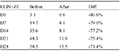
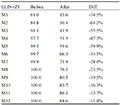
3.3 Evolution of risks before and after ITPS alone model ZeroVector®
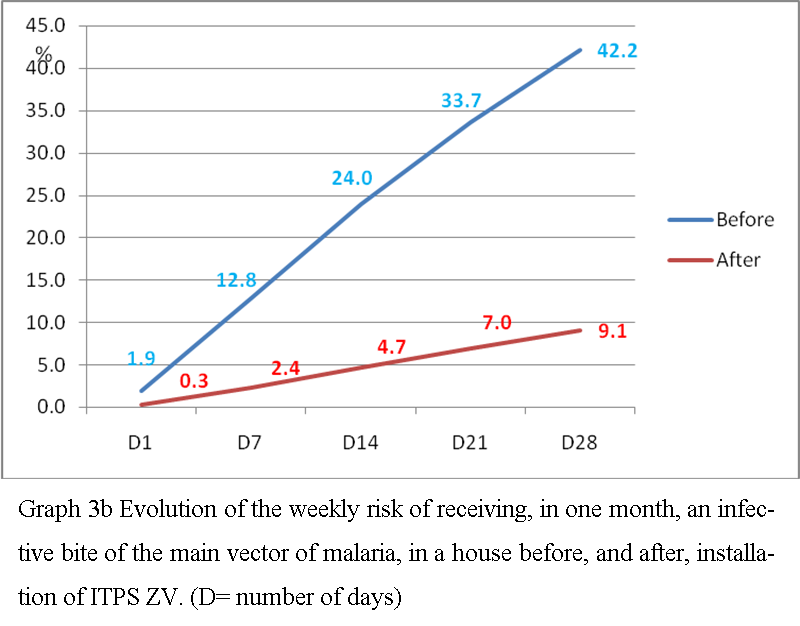
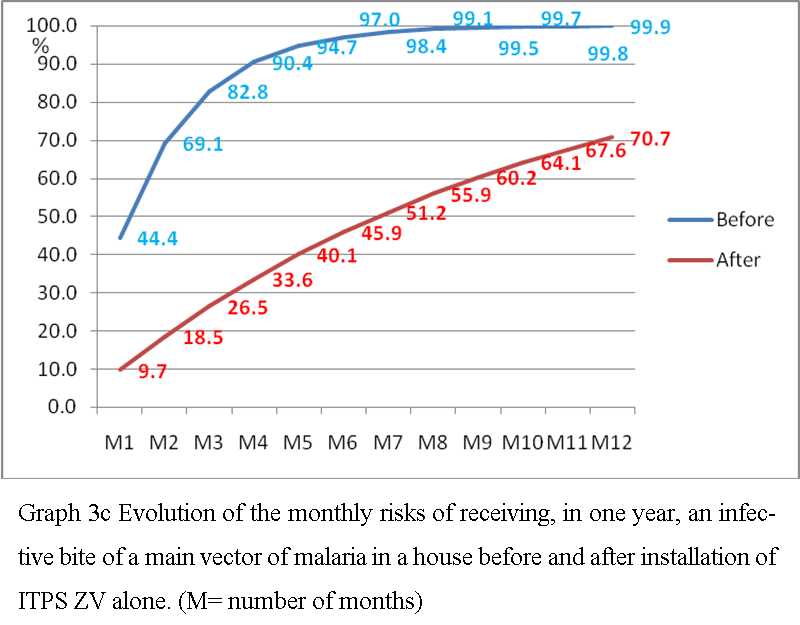
With full coverage in ITPS ZV only, the number of main vectors per trap decreased from 0.42 to 0.07 and the sporozoite index remained almost the same: 4.54% then 4.76%. With these data in the Birley’s formula it is possible to calculate the risks of receiving an infective bite in sleeping one day, one week, one month (Graph 3a, Graph 3b), one year (Graph 3c) in a house before, and after, installation of ITPS ZV alone.
|
Graph 3a Evolution of the daily risks, in one month, of receiving an infective bite of the main vector of malaria in a house before and after installation of ITPS ZF alone. (D= number of days) |
.png)
|
Graph 3b Evolution of the weekly risk of receiving, in one month, an infective bite of the main vector of malaria, in a house before, and after, installation of ITPS ZV. (D= number of days) |
|
Graph 3c Evolution of the monthly risks of receiving, in one year, an infective bite of a main vector of malaria in a house before and after installation of ITPS ZV alone. (M= number of months) |
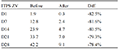
3.3.1 Evolution of the weekly risk in one month
In a house without vector control, the weekly risk sharply increased, 2% in one day; 13% in one week; 24% in two weeks; 34% in three weeks and 42% in four weeks (Graph 3b). With installation of ITPS ZV® alone they were respectively reduced to 0.3%; 2.4%; 5%; 7% and 9%; meaning that ITPS alone conferred some 80% reduction of risks the first month (Table 3a).
|
Table 3a Evolution of the weekly risks, in one month, of getting an infective bite before and after full coverage in ITPS ZV alone with the difference of risks induced |
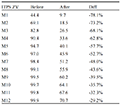
3.3.2 Evolution of the monthly risk in one year
Without vector control the risks were high with 44% in one month; 83% in three months; 97% in six months. After installation of ITPS ZV® the risks dropped respectively at 10%; 26%; and 46% (Table 3b). Insecticide treated plastic, model ZeroVector® alone, conferred a relatively more efficient and longer protection than LLINs alone, or in combination with ITPS ZF; with 50% till 7th month and even a 30% reduction of risk after one year (Graph 3c).
|
Table 3b Evolution of the monthly risk of receiving an infective bite of main vector of malaria in a house before and after installation of ITPS ZeroVector® alone, and the difference of risks |
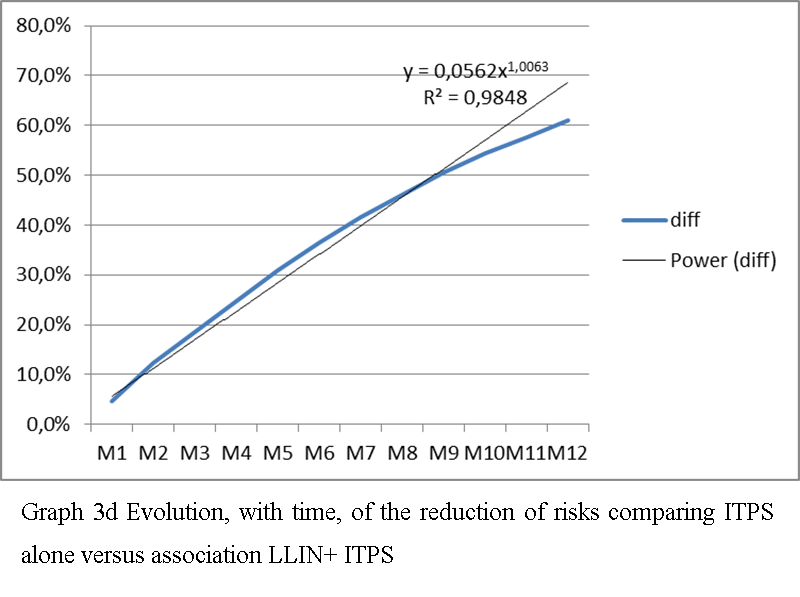
In term of risk, at house level, ITPS ZV alone appeared a promising efficient tool with its longer, and higher, efficacy, compared to LLINs alone. Comparing the reduction of risks by ITPS ZV alone (Table 3b) versus combination LLIN + ZF (Table 2b) it appeared (Table 3c) that the protection was better and longer with ITPS ZV alone than adding nets and wall lining (Graph 3d).
|
Table 3c Increasing protection with time conferred by ITPS ZV alone versus combination LLIN+ ITPS ZF (diff= difference) |
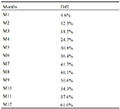
|
Graph 3d Evolution, with time, of the reduction of risks comparing ITPS alone versus association LLIN+ ITPS |
3.4 Evolution of risk before and after IRS then ITPS
With two rounds of inside house spraying with lambdacyhalothrin, then installation of ITPS (deltamethrin), the number of main vectors per trap decreased from 0.50 to 0.13 and the sporozoite index dropped from 7.14% to 5.26%. With these data in the Birley’s formula it is possible to calculate the risk of receiving an infective bite in sleeping one day, one week, one month (Graph 4a, Graph 4b), one year (Graph 4c) in house before and after IRS then ITPS.
|
Graph 4a Evolution of the daily risks, in one month, of receiving an infective bite of main vector of malaria in a house before and after installation of ITPS ZF alone. (D= number of days) |
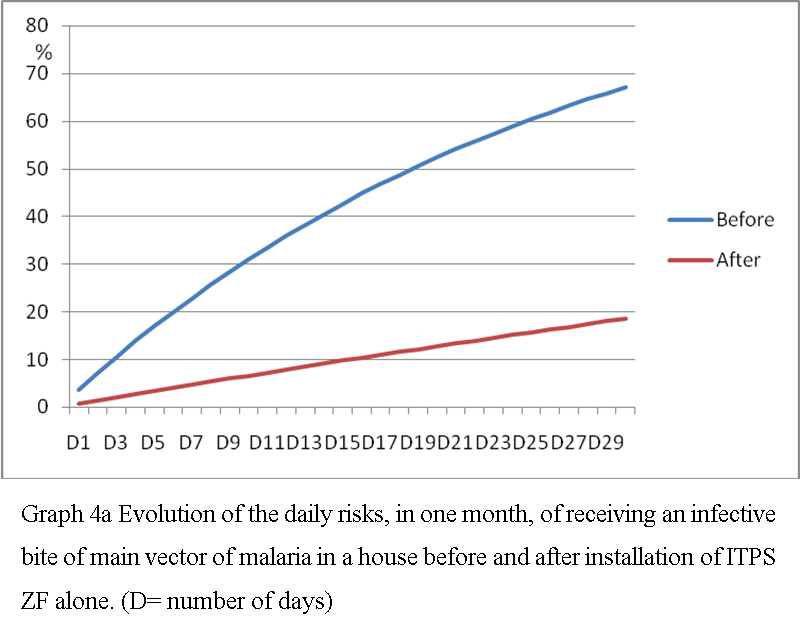
|
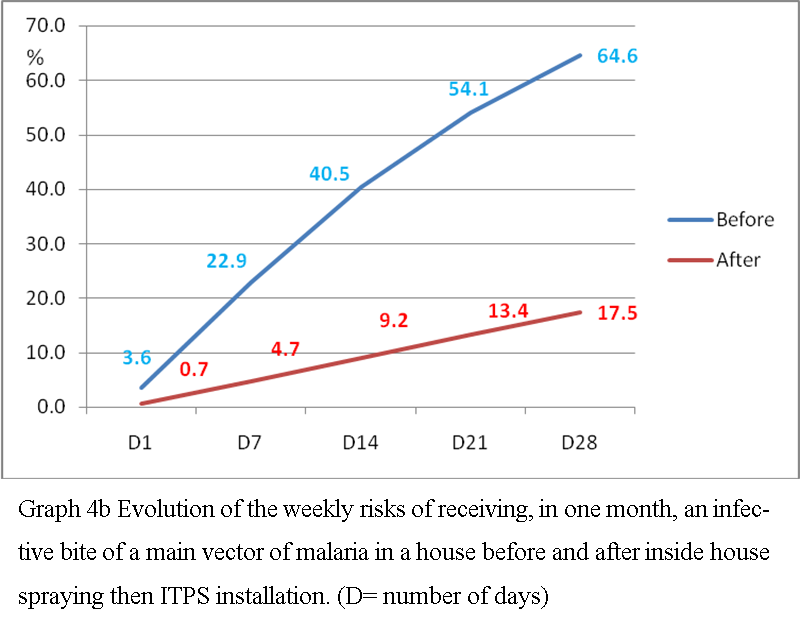
Graph 4b Evolution of the weekly risks of receiving, in one month, an infective bite of a main vector of malaria in a house before and after inside house spraying then ITPS installation. (D= number of days) |
|
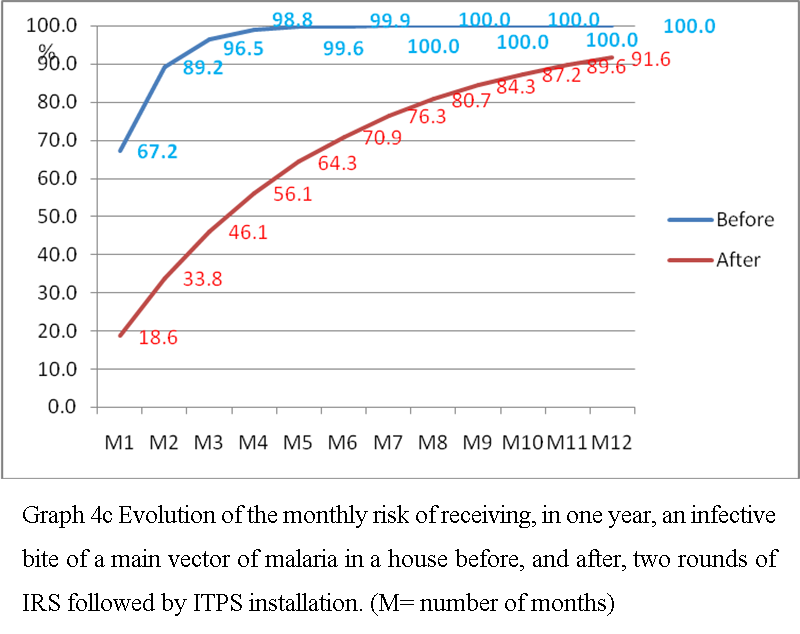
Graph 4c Evolution of the monthly risk of receiving, in one year, an infective bite of a main vector of malaria in a house before, and after, two rounds of IRS followed by ITPS installation. (M= number of months) |
3.4.1 Evolution of the weekly risk in one month
Before house spraying the risks quickly increased with time, with 4% in one day; 23% in one week; > 50% in three weeks and 65% in one month (Graph 4b). With vector control these risks decreased < 1% in one day; 5% in one week; 13% in three weeks and 17% in one month meaning a 75-80% reduction of risks in one month (Table 4a).
|
Table 4a Evolution of the weekly risks, in one month, of getting an infective bite before, and after, inside house spraying followed by ITPS installation, with the difference of risks induced |
3.4.2 Evolution of the monthly risk in one year
Before house spraying the risks were very high with nearly 70% in one month; nearly 90 in two months; 99% in four months (Table 4b). The risks decreased respectively < 20% in one month; 34% in two months; 56% in four months but reached 90% the 11th-12th month. The reduction of risks came from 72% to 10% in one year, reaching 50% in three months; 30% in six months; still 20% in eight months and almost 10% in one year (Graph 4c).
|
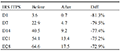
Table 4b Evolution of the monthly risks of receiving an infective bite of a main vector of malaria in a house before and after house spraying followed by ITPS installation, and the difference of risks |
3.5 Average evolution of risks before and after vector control
Following vector control the average number of main vectors per trap decreased from 0.58 to 0.17 and the sporozoite index dropped from 4.53% to 2.59%. With these data in the Birley’s formula it is possible to calculate the risks of receiving an infective bite in sleeping one day, one week, one month (Graph 5a, Graph 5b), one year (Graph 5c) in house before, and after, IRS then ITPS.
|
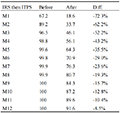
Graph 5a Evolution of the daily risks, in one month, of receiving an infective bite of main vector of malaria in a house before and after implementation of vector control. (D= number of days) |
|
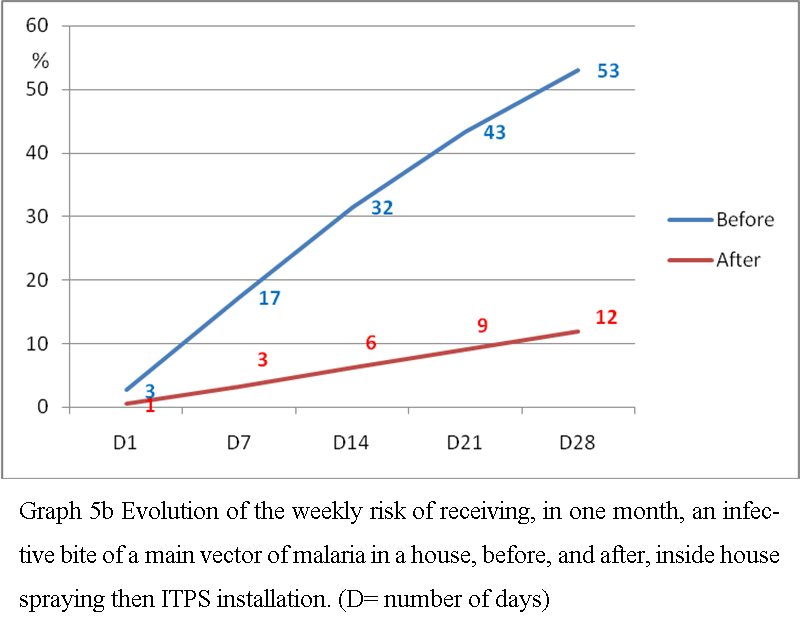
Graph 5b Evolution of the weekly risk of receiving, in one month, an infective bite of a main vector of malaria in a house, before, and after, inside house spraying then ITPS installation. (D= number of days) |
|
Graph 5c Evolution of the monthly risks of receiving, in one year, an infective bite of a main vector of malaria in a house before, and after, vector control. (M= number of months) |
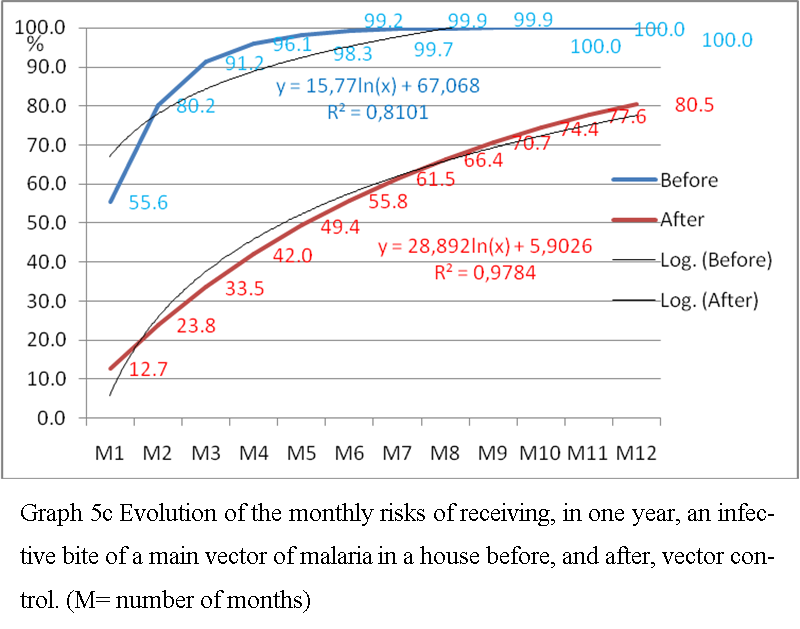
Before vector control the risk of being infected reached 50% the 26th day; in one month the risk was 55.5% without vector control and 12.7 after vector control meaning a 77% reduction of risks conferred by vector control the first month.
3.5.1 Evolution of the weekly risk in one month
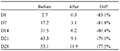
Before vector control the risks quickly increased with time, with 3% in one day; 17% in one week; > 40% in three weeks and > 50% in one month (Table 5a). After vector control the risks dropped respectively to < 1% in one day 3%; in one week; < 10% in three weeks and 12% in one month meaning an 80% reduction during one month.
|
Table 5a Evolution of the weekly risks, in one month, of getting an infective bite before and after vector control, with the difference of risks induced |
3.5.2 Evolution of the monthly risk in one year
Without vector control the risk of being infected was > 50% in one month; reached > 90% in three months and >99% in six months. With vector control implementation, the risks were reduced by 77% in one month; >60% in three months and > 40% in six months. Even in one year, vector control reduced transmission by 20% (Table 5b). In one year, the difference of risk remained spectacular after implementation of vector control (Graph 5c). The risks increased as logarithmic function of time (Graph 5c) and, correlatively, the reduction of risks induced by vector control decreased as logarithmic function of time (Graph 6).
|
Graph 6 Evolution of the reduction of risks conferred by vector control according to the duration of stay. (M= number of months) |
.png)
|
Table 5b Evolution of the monthly risks of receiving an infective bite of a main vector of malaria in a house before, and after, vector control, and the difference of risks |
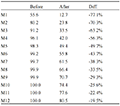
With vector control 80 to 20 % of new inoculations could be averted. The 20% reduction observed even after one year of exposure in noteworthy at community level and for programming vector control operations.
3.6 Synthesis
Gathering the level increasing risks with time and reduction of risks, conferred by each one of the four methods of vector control (Table 6) showed that, excepted LLIN, the level of protection was about 70% the first month with an average of 77%; a level which appeared well in line with the 80% protection usually considered for vector control. Then the protection decreased with time but could still be around 30% in one year with insecticide treated plastic sheeting model ZeroVector® alone. With implementation of vector control the average reduction was about 20% which is greatly appreciable at community level.
|
Table 6 Evolution, with time, of the protection afforded by each method of vector control. (M= number of months) |
.png)
The evolution of level of protection with duration of exposure was different according to the method of vector control (Graph 6). With time: six months “M6”; nine months “M9”, one year “M12”, the reduction of risks conferred by ITPS ZeroVector® (“ZV”) alone appeared clearly higher than the other methods (Graph 7).
|
Graph 7 Reduction of risk according to the method of vector control and duration of exposure. (M= number of months) |
.png)
4 Discussion-Conclusion
The notion of “risks” appeared the article “Malaria Vectorial Capacity of a Population of Anopheles gambiae. An Exercise in Epidemiological Entomology” (Garrett-Jones and Shidrawi, 1969). “The index of inoculation risk was derived from the infective density by taking into account the mosquito's supposed biting-frequency and the average number of people per house. It may be noted that a similar "risk of infection index", but based on the incidence of infective mosquitos caught biting, has recently been proposed. The need for a fresh quantitative approach to the interacting entomological variables that play a part in determining the malaria inoculation rate became evident in the years immediately following the widespread introduction of DDT.
Boyd (1949) pointed out that malariologists had largely ignored Ross (Ross, 1911) mathematical expression of the various factors involved in the perpetuation of a malaria situation; and in concluding his full review of the entomological factors (pp. 608-697) he wrote:" It is to be regretted that even now quantitative values for Ross's factors are lacking. Observed data enable us to assign values to many of the factors on the human side of the equation, but not those pertaining to the vector. "
Another landmark was the concept of vectorial capacity (Garrett-Jones, 1964a) which is density-dependent, the parameter of density to be measured is the man-biting rate (“ma”) with the issue of sampling (Service, 1970; Service, 1977), the longevity (“p”) of vectors involved (Detinova, 1962) and the length of the sporogonic development of the Plasmodium species involved (“n”), but not the infectivity “s” (with the issues of ELISA versus salivary glands classical examination) (Fontenille et al., 2001; Bassene et al., 2009).
The changes of vectorial capacity induced by vector control operations targeting adults’ vectors was largely used. DDT house spraying in Northern Nigeria “reduced the malaria vectorial capacity of Anopheles gambiae sp B (the main vector of Plasmodium falciparum in the area) by an over-all factor of about 23 times.” (Garrett-Jones and Shidrawi, 1969). Vectorial capacity was also used to evaluate the impact of inside residual spraying with propoxur during three years (with one year as control) during the Garki Project (N Nigeria) and the mathematical model developed from data obtained (Dietz et al., 1974; Molineaux et al., 1978). Evolution of vectorial capacity was also evaluated with data collected in Kisumu (Kenya) over a period of three years including 20 months during which the insides of houses were sprayed with fenitrothion (Molineaux et al., 1978).
The Balombo Project adopted the same protocol as Garki project with two years control and three years following vector control implementation. The entomological inoculation rate (EIR) is easier to evaluate as involving only two parameters: biting rate (‘ma”) and infectivity (s) and was largely used recently (Hay et al., 2000; Elissa et al., 2003; Kelly-Hope and McKenzie, 2009; Mboera et al., 2010; Shaukat et al., 2010; Das et al., 2017; Amoah et al., 2021; Doumbe-Belisse et al., 2021; Ukawuba and Shaman, 2022; Degefa et al., 2024).
But as presented, the EIR, such as vectorial capacity, seems to increase as a linear function of time while in the Birley’s formula the risk is log function of density, infectivity and times of exposure. This is well in line with the analysis of “31 sites throughout Africa to establish fundamental relationship between annual EIRs and the prevalence of Plasmodium falciparum malaria infection. The majority of sites fitted a linear relationship (r2= 0.71) between malaria prevalence and the logarithm of the annual EIR” (Beier et al., 1999). It was considered that” the analysis also highlights that the EIR is a more direct measure of transmission intensity than traditional measures of malaria prevalence or hospital-based measures of infection or disease incidence. Therefore, malaria field programs need to consider both entomologic and clinical assessments of the efficacy of transmission control measures.” This approach was actually implemented in the Balombo project with parasitological surveys systematically done two weeks after each entomological survey (Carnevale et al., 2024) such as the protocol already implemented in Northern Cote d’Ivoire to evaluate the efficacy of lambda cyhalothrin treated nets in an area where the main vector, Anopheles gambiae has a kdr based resistance to pyrethroid (Henry et al., 2005).
Such comprehensive approach was already carried out, in Burkina Faso, several decades ago, to evaluate the efficacy of house spraying in the Pilot zone of Bobo-Dioulasso (Hamon et al., 1959); and, more recently, in Peru where parasitological observations were made along with entomological one for an epidemiological evaluation of vector control (Rosas-Aguirre et al., 2021).
The village scale Balombo vector control project was planned to follow the simultaneous changes of entomological and parasitological index during five years, then parasitological surveys were done for six years more to check for an eventual “rebound effect” long time after cessation of vector control. Entomological data were used to evaluate, with the Birley’s formula, the evolution of risks of being infected, before and after vector control, but also with the time spent in these conditions. Before vector control the risks increased sharply, as a log function of time, reaching 3% in one day; almost 20% in one week; more than 50% in one month and more than 90% in six months. This means that communities, permanently living in such context, will, likely, be malaria infected and vector control is an absolutely need. Actually, risks were greatly reduced, for several months, after vector control, the best having been obtained after installation of insecticide treated plastic sheeting on the walls, inside the houses.
But, even with such a successful vector control, the risks of being infected in one year remained high. This induced the need for regularly repeated vector control operations, in a comprehensive program including, among other measures, improved diagnosis and case management at the most peripheral level. The long-lasting nets must keep their entomological efficacy for three, and more, years but it appeared that, in one year in the field, the risks became as high as before vector control, rising concern to program managers, and this could participate to explain the stalling of malaria situation reported by WHO.
The longer lasting efficacy of insecticide treated plastic sheeting open a new field of research, for example fitting then with treated nets, combining different insecticide to deal with insecticide resistance (Ngufor et al., 2014). To know the risks in living, more or less long time, in malarious area (or period), and their reduction with vector control, (Molineaux and Hempel, 1989; Baudon and Martet, 1997; Batchelor and Gherardin, 2007; Pistone et al., 2010; Wendt et al., 2021), should be important for temporary workers, or displaced population, or tourists as well as for communities living in these areas.
Acknowledgments
Many thanks to the managers of the Angolese Sonamet® Company in Lobito who supported the Balombo Project through their Malaria Control Program (MCP) in its Medical Department. Many thanks to MCP agents involved in the Balombo program. Many thanks to the communities of the villages where traps were regularly installed in their houses and their help in ITPS installation.
Conflicts of Interest
Authors confirmed there is no conflict-of-interest. The document was prepared without any a.i.
Authors
NC was involved in data analysis and writing, GC was involved in data analysis, writing, editing English. BO was involved in writing, discussion of data and English editing PC was involved in field surveys, data collection and analysis, writing the document They read and approved the document. No need of ethical clearance as this work dealt only with mosquitoes.
Amoah B., McCann R.S., Kabaghe A.N., Mburu M.M., Chipeta M., and Moraga P., 2021, Identifying Plasmodium falciparum transmission patterns through parasite prevalence and entomological inoculation rate, Elife, 10: e65682.
Bassene H., Kengne P., Ndiath M.O., Sokhna C., Dupressoir T., and Fontenille D., 2009, Comparison of PCR, ELISA-CSP and direct microscopic observation methods for the detection of Plasmodium falciparum sporozoites in Anopheles gambiae M in Senegal, Bulletin de la Société de Pathologie Exotique, 102(4): 233-237.
Batchelor T. and Gherardin T., 2007, Prevention of malaria in travellers, Australian Family Physician, 36(5): 316-320.
Baudon D. and Martet G., 1997, Malaria and travellers : protection and information, Médecine Tropicale (Marseille), 57(4 Suppl.): 497-500.
Beier J.C., Killeen G.F., and Githure J.I., 1999, Entomologic inoculation rates and Plasmodium falciparum malaria prevalence in Africa, American Journal of Tropical Medicine and Hygiene, 61(1): 109-113.
doi.org/10.4269/ajtmh.1999.61.109
Beier J.C., Perkins P.V., Wirtz R.A., Whitmire R.E., Mugambi M., Hockmeyer W.T., and Diggs C.L., 1987, Field evaluation of an enzyme-linked immunosorbent assay (ELISA) for Plasmodium falciparum sporozoite detection in anopheline mosquitoes from Kenya, American Journal of Tropical Medicine and Hygiene, 36(3): 459-468.
doi.org/10.4269/ajtmh.1987.36.459
Bhatt S., Weiss D.J., Cameron E., Bisanzio D., Mappin B., Dalrymple U., Battle K.E., Moyes C.L., Henry A., Eckhoff P.A., Wenger E.A., Briet O., Penny M.A., Smith T.A., Bennett A., Yukich J., Eisele T.P., Griffin J.T., Fergus C.A., Lynch M., Lindgren F., Cohen J.M., Murray C.L.J., Smith D.L., Hay S.I., and Gething P.W., 2015, The effect of malaria control on Plasmodium falciparum in Africa between 2000 and 2015, Nature, 526(7572): 207-211.
Boyd M.F., 1949, Malariology, Saunders, Philadelphia & London, 1: 608.
Brosseau L., Drame P.M., Besnard P., Toto J.C., Foumane V., Dos Santos A., Fortes F., and Carnevale P., 2012, Human antibody response to Anopheles saliva for comparing the efficacy of three malaria vector control methods in Balombo, Angola, PLoS One, 7(9): e44189.
doi.org/10.1371/journal.pone.0044189
Bruce-Chwatt L.J., 1985, Essential Malariology, William Heinemann Medical Books, London.
Carnevale P., Toto J.C., Foumane V., Fortes F., Ingles A., Soyto A., and Dos Santos A., 2024, The Balombo Project (Angola): a long-term village-scale malaria vector control program comparing four methods-long-lasting insecticide-treated nets alone, insecticide-treated plastic sheeting alone or combined with long-lasting insecticide-treated nets, or two rounds of indoor residual spraying. I. First entomological and parasitological evaluation, Clinical Reviews and Case Reports, 3(6): 086.
doi.org/10.31579/2835-7957/086
Das S., Muleba M., Stevenson J.C., Pringle J.C., and Norris D.E., 2017, Beyond the entomological inoculation rate: characterizing multiple blood feeding behavior and Plasmodium falciparum multiplicity of infection in Anopheles mosquitoes in northern Zambia, Parasites & Vectors, 10(1): 45.
doi.org/10.1186/s13071-017-1993-z
Degefa T., Yewhalaw D., and Yan G., 2024, Methods of sampling malaria vectors and their reliability in estimating entomological indices in Africa, Journal of Medical Entomology, 61(3): 573-583.
Detinova T.S., 1962, Age-grouping methods in Diptera of medical importance with special reference to some vectors of malaria, World Health Organization Monograph Series, 47: 13-191.
Dietz K., Molineaux L., and Thomas A., 1974, A malaria model tested in the African savannah, Bulletin of the World Health Organization, 50(3-4) : 347-357.
Doumbe-Belisse P., Kopya E., Ngadjeu C.S., Sonhafouo-Chiana N., Talipouo A., and Djamouko-Djonkam L., 2021, Urban malaria in sub-Saharan Africa: dynamics of the vectorial system and the entomological inoculation rate, Malaria Journal, 20(1): 364.
doi.org/10.1186/s12936-021-03891-z
Elissa N., Migot-Nabias F., Luty A.J.F., Renaut A., Touré F., Vaillant M., and Deloron P., 2003, Relationship between entomological inoculation rate, Plasmodium falciparum prevalence rate, and incidence of malaria attacks in rural Gabon, Acta Tropica, 85(3): 355-361.
doi.org/10.1016/S0001-706X (02)00266-8
Fontenille D., Meunier J.Y., Nkondjio C.A., and Tchuinkam T., 2001, Use of circumsporozoite protein enzyme-linked immunosorbent assay compared with microscopic examination of salivary glands for calculation of malaria infectivity rates in mosquitoes (Diptera: Culicidae) from Cameroon, Journal of Medical Entomology, 38(3): 451-454.
doi.org/10.1603/0022-2585-38.3.451
Garrett-Jones C. and Grab B., 1964, The assessment of insecticidal impact on the malaria mosquito's vectorial capacity, from data on the proportion of parous females, Bulletin of the World Health Organization, 31(1): 71-86.
Garrett-Jones C. and Shidrawi G.R., 1969, Malaria vectorial capacity of a population of Anopheles gambiae: an exercise in epidemiological entomology, Bulletin of the World Health Organization, 40(4): 531-545.
Garrett-Jones C., 1964, Prognosis for interruption of malaria transmission through assessment of the mosquito's vectorial capacity, Nature, 204: 1173-1175.
Garrett-Jones C., 1964, The human blood index of malaria vectors in relation to epidemiological assessment, Bulletin of the World Health Organization, 30: 241-261.
Gazin P., Robert V., Akogbeto M., and Carnevale P., 1985, Risk of malaria infection according to the density and infectivity of Anopheles, Annales de la Société Belge de Médecine Tropicale, 65(3): 263-269.
Hamon J., Choumara R., Adam J.P., Bailly H., and Ricosse J., 1959, Le paludisme dans la zone pilote de Bobo-Dioulasso, Haute-Volta, Cahiers ORSTOM, 1: 125.
Hay S.I., Rogers D.J., Toomer J.F., and Snow R.W., 2000, Annual Plasmodium falciparum entomological inoculation rates (EIR) across Africa : literature survey, Internet access and review, Transactions of the Royal Society of Tropical Medicine and Hygiene, 94(2): 113-127.
doi.org/10.1016/S0035-9203(00)90246-3
Henry M.C., Assi S.B., Rogier C., Dossou-Yovo J., Chandre F., Guillet P., and Carnevale P., 2005, Protective efficacy of lambda-cyhalothrin treated nets in Anopheles gambiae pyrethroid resistance areas of Côte d'Ivoire, American Journal of Tropical Medicine and Hygiene, 73(5): 859-864.
doi.org/10.4269/ajtmh.2005.73.859
Kelly-Hope L.A. and McKenzie F.E., 2009, The multiplicity of malaria transmission: a review of entomological inoculation rate measurements and methods across sub-Saharan Africa, Malaria Journal, 8: 19.
doi.org/10.1186/1475-2875-8-19
Macdonald G., 1957, The Epidemiology and Control of Malaria, Oxford University Press, London.
Mboera L.E.G., 2005, Sampling techniques for adult Afrotropical malaria vectors and their reliability in the estimation of entomological inoculation rate, Tanzania Health Research Bulletin, 7(3): 117-124.
doi.org/10.4314/thrb. v7i3.14248
Mboera L.E.G., Senkoro K.P., Mayala B.K., Rumisha S.F., Rwegoshora R.T., Mlozi M.R.S., and Shayo E.H., 2010, Spatio-temporal variation in malaria transmission intensity in five agro-ecosystems in Mvomero district, Tanzania, Geospatial Health, 4(2): 167-178.
Molineaux L. and Hempel J., 1989, Malaria and international travel, World Health Statistics Quarterly, 42(2): 100-106.
Molineaux L., Dietz K., and Thomas A., 1978, Further epidemiological evaluation of a malaria model, Bulletin of the World Health Organization, 56(4): 565-571.
Molineaux L., Shidrawi G.R., Clarke J.L., Boulzaguet J.R., and Ashkar T.S., 1979, Assessment of insecticidal impact on the malaria mosquito's vectorial capacity, from data on the man-biting rate and age-composition, Bulletin of the World Health Organization, 57(2): 265-274.
Ngufor C., Tchicaya E., Koudou B.G., N'Fale S., Dabire R.K., Johnson P.C.D., and Rowland M., 2014, Combining organophosphate-treated wall linings and long-lasting insecticidal nets for improved control of pyrethroid-resistant Anopheles gambiae, PLoS One, 9(1): e83897.
doi.org/10.1371/journal.pone.0083897
Pistone T., Ezzedine K., Gaudin A., Hercberg S., Nachbaur G., and Malvy D., 2010, Malaria prevention behavior and risk awareness in French adult travellers, Travel Medicine and Infectious Disease, 8(1): 13-21.
doi.org/10.1016/j.tmaid.2009.10.005
Rosas-Aguirre A., Moreno M., Moreno-Gutierrez D., Llanos-Cuentas A., Saavedra M., Contreras-Mancilla J., Chuquiyauri R., Gamboa D., and Vinetz J.M., 2021, Integrating parasitological and entomological observations to understand malaria transmission in riverine villages in the Peruvian Amazon, Journal of Infectious Diseases, 223 (Suppl 2): S99-S110.
doi.org/10.1093/infdis/jiaa496
Ross R., 1911, The Prevention of Malaria, John Murray, London, pp.768.
Service M.W., 1970, A battery-operated light-trap for sampling mosquito populations, Bulletin of the World Health Organization, 43(4): 635-641.
Service M.W., 1977, The need for improved methods for sampling mosquito populations, Wiadomości Parazytologiczne, 23(1-3): 203-206.
Shaukat A., Breman J.G., and McKenzie F.E., 2010, Using the entomological inoculation rate to assess the impact of vector control on malaria parasite transmission and elimination, Malaria Journal, 9: 122.
doi.org/10.1186/1475-2875-9-122
Smith D.L., McKenzie F.E., Snow R.W., and Hay S.I., 2007, Revisiting the basic reproductive number for malaria and its implications for malaria control, PLoS Biology, 5(3): e42.
doi.org/10.1371/journal.pbio.0050042
Ukawuba I. and Shaman J., 2022, Inference and dynamic simulation of malaria using a simple climate-driven entomological model of malaria transmission, PLoS Computational Biology, 18(6): e1010161.
doi.org/10.1371/journal.pcbi.1010161
Wendt S., Beier D., Paquet D., Trawinski H., Fuchs A., and Lübbert C., 2021, Medical advice for travellers, Deutsches Ärzteblatt International, 118(21): 349-356.
doi.org/10.3238/arztebl.m2021.0127
Wirtz R.A., Burkot T.R., Graves P.M., and Andre R.G., 1987, Field evaluation of enzyme-linked immunosorbent assays for Plasmodium falciparum and Plasmodium vivax sporozoites in mosquitoes (Diptera: Culicidae) from Papua New Guinea, Journal of Medical Entomology, 24(4): 433-437.
doi.org/10.1093/jmedent/24.4.433
World Health Organization, 2024, World malaria report 2024: Addressing inequity in the global malaria response, Global Malaria Programme, World Health Organization, Geneva, pp.316.

. PDF(1128KB)
. HTML
Associated material
. Readers' comments
Other articles by authors
. N. Carnevale
. G. Carnevale
. B. Monbeig
. P. Carnevale
Related articles
. Malaria transmission
. Vector control method
. Birley’s formula
Tools
. Email to a friend
. Post a comment